PCA
10.2.1 What Are Principal Components?
«PRML»
1) 데이터를 principal subspace 라고 하는 더 낮은 선형 공간에 직교 투영하는 과정. 투영과정은 투영된 데이터의 분산이 최대화 되는 방향
https://ratsgo.github.io/machine%20learning/2017/04/24/PCA/
$max_\alpha Var( \alpha X ) = max_\alpha \alpha' Var(X) \alpha = max_\alpha \alpha'\Sigma \alpha $ s.t. $||\alpha||= 1 $
lagrange multiplier, $ L = \alpha' \Sigma \alpha - \lambda (\alpha ' \alpha - 1) $
$ { {\partial L}\over{\partial \alpha} } = \Sigma \alpha - \lambda \alpha = 0 $
$ (\Sigma - \lambda)\alpha = 0 $
⇒ $\alpha$ 는 covariance matrix 의 eigenvector for eigenvalue $\lambda $
⇒ 왼쪽에 $\alpha'$ 곱하면 $\alpha'\Sigma \alpha = \lambda $, 최대화하려면 제일 큰 eigenvalue
⇒ 2nd : 직교하는 모든 방향에 대해서.. 귀납법으로 증명 가능
2) 평균 투영비용(데이터 포인트와 그 투영체 간의 평균 제곱거리)을 최소화하는 선형 투영.
- linear regression과의 차이점
3) probabilistic laten variable model의 Maximum likelihood의 해로 표현
D차원의 관측변수 x는 M차원의 잠재변수 z(principal subspace)를 선형변환하고 여기에 추가적인 Gaussian 'Noise'를 합산한 것
x = Wz + mu + \epsilon
p(z) = N(z|0,I)
p(x|z) = N(x|Wz+mu, \sigma^2 I)
first component :
argmax( $ \phi_{j1} $ ) $ { {1\over n} \sum ( \sum \phi_{j1} x_{ij})^2 } $ s.t. $ \sum \phi_{j1}^2 = 1 $
(X의 각 변수가 평균이 0이 되게 centralized되었다고 가정.)
제한 하에서 가장 큰 표본 분산을 가지는 선형결합
eigen-decomposition
A Tutorial on Principal Component Analysis
X : p x n
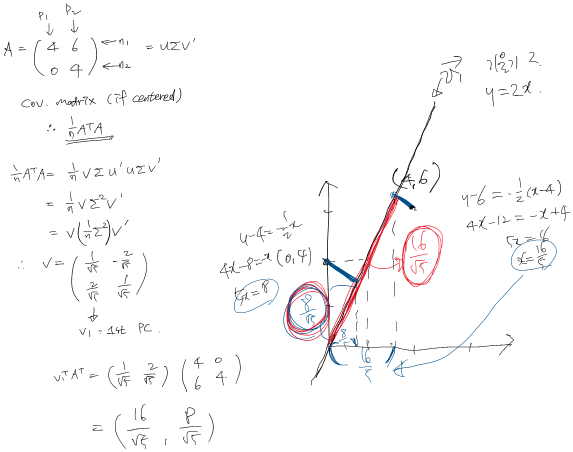
covariance matrix $C_X = {1\over n} XX' $
Find some orthonormal matrix P in Y = PX such that $C_Y ≡ {1\over n} YY'$ is a diagonal matrix.
The rows of P are the principal components of X.
$ C_Y = {1\over n} (PX)(PX)' = {1\over n} PC_X P' $
by eigen-decomposition, $ C_X = E'DE $ exists.
select P = E'
⇒ $C_Y = P(P'DP)P' = D $
⇒ choice of P diagonalize $C_Y$ : goal of PCA
⇒ The principal components of X are the eigenvectors of $ C_X = {1\over n} XX' $
10.2.2 Another Interpretation of Principal Components
주성분들은 관측치들에 closest 저차원 선형 surface들을 제공.
first loading vector : n개 관측치에 가장 가까운 p차원 공간의 직선(distance measure Euclidean^2의 평균)
1st ,2nd components : 유클리드 거리 제곱의 평균이 n개 관측치에 가장 가까운 평면을 span.
⇒ $ x_{ij} \approx \sum_m^M z_{im} \phi_{jm} $ : i번째 관측치 x_ij에 대한 최고의 M차원 근사치
10.2.3 More on PCA
PCA 전 변수들은 평균이 0이 되게 해야함. scaling 여부에 따라 결과가 다름 (측정단위가 다르면 scaling 필요)
not centered? : When people talk about “PCA on non-centered data”, they mean that instead of covariance matrix the eigen-decomposition is performed on the XX'/(n−1) matrix. If X is centered then this will be exactly the covariance matrix. If not then not.
https://stats.stackexchange.com/questions/189822/how-does-centering-make-a-difference-in-pca-for-svd-and-eigen-decomposition
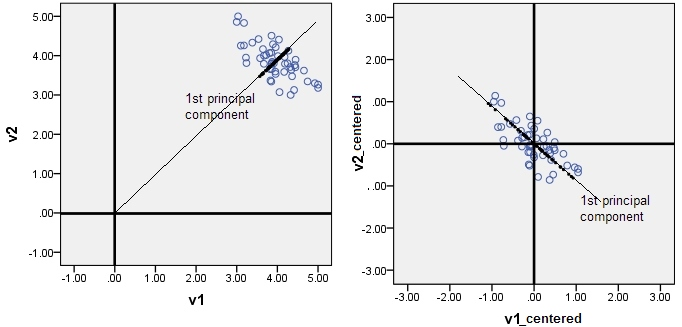
The pictures below are about PCA. PCA is a regressional model without intercept1. Thus, principal components inevitably come through the origin. If you forget to center your data, the 1st principal component may pierce the cloud not along the main direction of the cloud, and will be (for statistics purposes) misleading.
PCA isn't a regression analysis, of course. It however shares formally same linear equation (linear combination) with linear regression. PCA equation is like linear regression equation without intercept - because PCA is a rotation operation.

https://stats.stackexchange.com/questions/22329/how-does-centering-the-data-get-rid-of-the-intercept-in-regression-and-pca%20
1. Mean centering does not affect the covariance matrix
2. Scaling of variables does affect the covariance matrix
3. Standardizing affects the covariance
https://sebastianraschka.com/faq/docs/pca-scaling.html
PC loading vector : 부호는 다를 수 있음 ⇐ 방향에는 부호 상관X, Z/-Z 분산 동일,
⇒ loding vector z_im, score vector $\phi_{jm} $ 부호가 둘다 바뀌면 곱은 바뀌지 않음
각 주성분에 의해 설명되는 분산의 비율 (PVE) :
1) $ {1\over n} \sum z_{im}^2 = {1\over n} \sum^n (\sum^p \phi_{jm} x_{ij})^2 $
2) $ \sum^p Var(X_j) = \sum^p {1\over n} \sum^n x_{ij}^2 $
⇒ 1) / 2)
몇개?
min(n-1,p) 개의 서로 다른 주성분을 가짐
스크리 그래프의 elbow
주관적인 기법, PCA가 일반적으로 EDA를 위한 도구로 사용된다는 사실
Factor Analysis
$ X - \mu = LF + \epsilon $
XW 가 아닌(X의 linear combination), F(latent factor)에 대응하는 L을 찾기 위한 것.
$ cov(X) = LL^T + \epsilon $
$ cov(X, F) = L $
$ X^TX = U \Sigma V^T$
$ L = WSigma^(1/2) A^T $
$ L_p $ 중 $L_m$ 만 선택, 나머지는 $\epsilon $
https://dogmas.tistory.com/entry/%EC%9D%B8%EC%9E%90%EB%B6%84%EC%84%9DFactor-analysis%EA%B3%BC-%EC%A3%BC%EC%84%B1%EB%B6%84%EB%B6%84%EC%84%9DPrincipal-component-analysis%EC%9D%98-%EC%B0%A8%EC%9D%B4%EC%99%80-%EB%B9%84%EC%8A%B7%ED%95%9C-%EC%A0%90-%EB%B9%84%EA%B5%90-SPSS-%EC%82%AC%EC%9A%A9%EC%84%A4%EB%AA%85%EC%84%9C-25
PCA를 좀 개괄적으로 설명하면 아래와 같다.
만약 데이터에 여기서 I1, I2, I3의 3개의 변수가 있다고 가정할때 여기에 L11, L12….L33등의 상수를 곱하여 선형조합을 만들어 새로운 변수 C1, C2, C3를 선형독립이 되도록 만든다. 개념적으로는 주어진 데이터의 변수로부터 component (C1, C2, C3)가 결과되어진다고 말한다. 즉 개념적으로 indicator(I1, I2, I3)가 component의 원인이 되는 것이다.
C1 = L11 * I1 + L12 * I2 + L13 * I3
C2 = L21 * I1 + L22 * I2 + L23 * I3
C3 = L31 * I1 + L32 * I2 + L33 * I3
그리고 C1, C2, C3 중에 원래 데이터를 잘설명해주는 것 몇개만을 고르면(예를 들어 C1과 C2만 선택) 데이터의 차원을 줄일수가 있다. C1, C2, C3 중에 몇개를 고르는지는 scree plot이나 eigen value를 이용한다.
그렇다면 factor analysis는 어떻게 다를까?
역시 똑같이 데이터에 I1, I2, I3등의 변수가 있다고 가정할때, factor analysis란 이들 3개의 변수가 우리가 아는 factor들로부터 어떻게 결과되어지는지를 나타내는 것이다. 즉 개념적으로 factor는 indicator의 원인이 된다.
I1 = L11 * F1 + L12 * F2 + e1
I2 = L21 * F1 + L22 * F2 + e2
I3 = L31 * F1 + L32 * F2 + e3
위와 같은 개념적 차이로 인하여 PCA는 data reduction에 사용한다고 하고 factor analysis는 structure detection에 사용한다고 말한다. 왜냐하면 PCA를 수행하면 I1, I2, I3, I4의 component들을 찾아내서 이중 몇개만 골라 principal componet로 삼으면 데이터의 차원을 줄일수 있고, factor analysis를 수행하여 찾아낸 factor가 F1과 F2 등 2개라고 가정하고 이때 F1에 가장 많은 영향을 받는 것은 I2와 I4이고 F2는 I1과 I3라고 가정할때 데이터의 구조를 쉽게 파악할수가 있기 때문이다


Discussion